
FINANCIAL & RISK ANALYTICS
See what changed ~ Know why ~ Plan what comes next
We turn your data into clear dashboards, forecasts and insights that show what is driving performance, where risks are growing and what management should focus on next.

PRACTICAL OUTPUTS FOR YOUR BUSINESS
What you receive
Clear analysis, practical explanations and useful tools that help management understand performance, spot risks early and decide what to do next

Decision-led KPI Framework
We select KPIs based on the decisions management needs to make. Each KPI clearly shows what it measures, who is responsible and when action is needed.

FP&A and Management Analysis
We prepare budgets, forecasts and updated outlooks, compare actual results with the plan and clearly explain what the numbers mean.

Driver and Variance Analysis
We identify what caused changes in revenue, profit margins, costs, cash and operations—showing which factors management can influence.
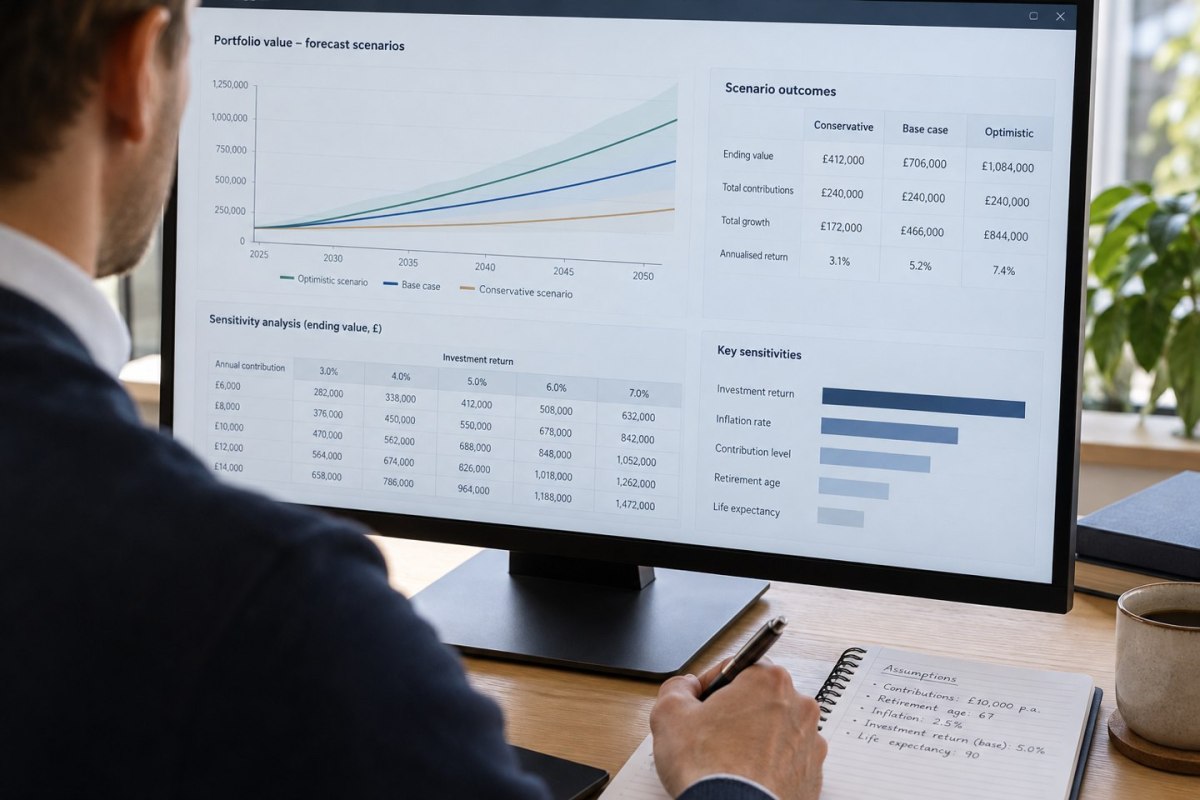
Scenario and Sensitivity Analysis
We test how changes in sales, prices, costs, timing and working capital could affect your results before you make an important decision.

Financial and Risk Analytics
We analyse trends and events to explain their causes, how likely they are, how they may affect your business and which warning signs to watch.

Business Health Score
When enough reliable data is available, we provide a health score for your overall business and its key functions—showing strengths, growing pressures and the areas that need attention first.
THE PROBLEM WE HELP YOU SOLVE
When the numbers show a problem—but not what caused it
A KPI may turn red, but you may not know whether the cause is pricing, sales volume, timing, productivity, customer mix or a process failure.
A forecast may look accurate but still be misleading if its assumptions do not reflect what is really happening in the business.
We connect financial results with operations and risk to explain what is changing, why it matters and what management can realistically do next.
The result for your business
01
Faster, more focused decisions
Teams spend less time questioning the numbers and more time deciding what action to take.
02
A clearer view of what lies ahead
Forecasts show what they are based on, what could change the result and where the greatest risks lie.
03
Focus on what makes the difference
Time and resources are directed towards the areas where the evidence shows the greatest impact.
How we work
A clear process that keeps the analysis focused, transparent and connected to the decisions you need to make.
01
Understand the decision and the questions management needs answered
02
Check the data and agree on how each KPI will be measured
03
Connect financial results with the business activities driving them
04
Analyse changes, trends and possible future scenarios
05
Identify the causes, risks and likely business impact
06
Present clear findings, priority actions and health indicators
From movement to meaning
When profit falls, we identify how much of the change came from price, sales volume, customer mix, costs, productivity or timing.
When cash becomes tight, we examine customer collections, inventory, supplier terms, upcoming payments and forecast assumptions.
The goal is simple: find the real cause and show management what it can do about it.
Turn performance data into a clearer view of the next decision
Tell us what changed, what concerns you or which decision lies ahead. We will help you identify the right analysis, scope and next step.

